
By sector
A shopping centre is a lot of people and very little data.
How many come in, through which door, how long they stay, which aisles are surplus and which queues are forming right now. With the cameras the centre already has.
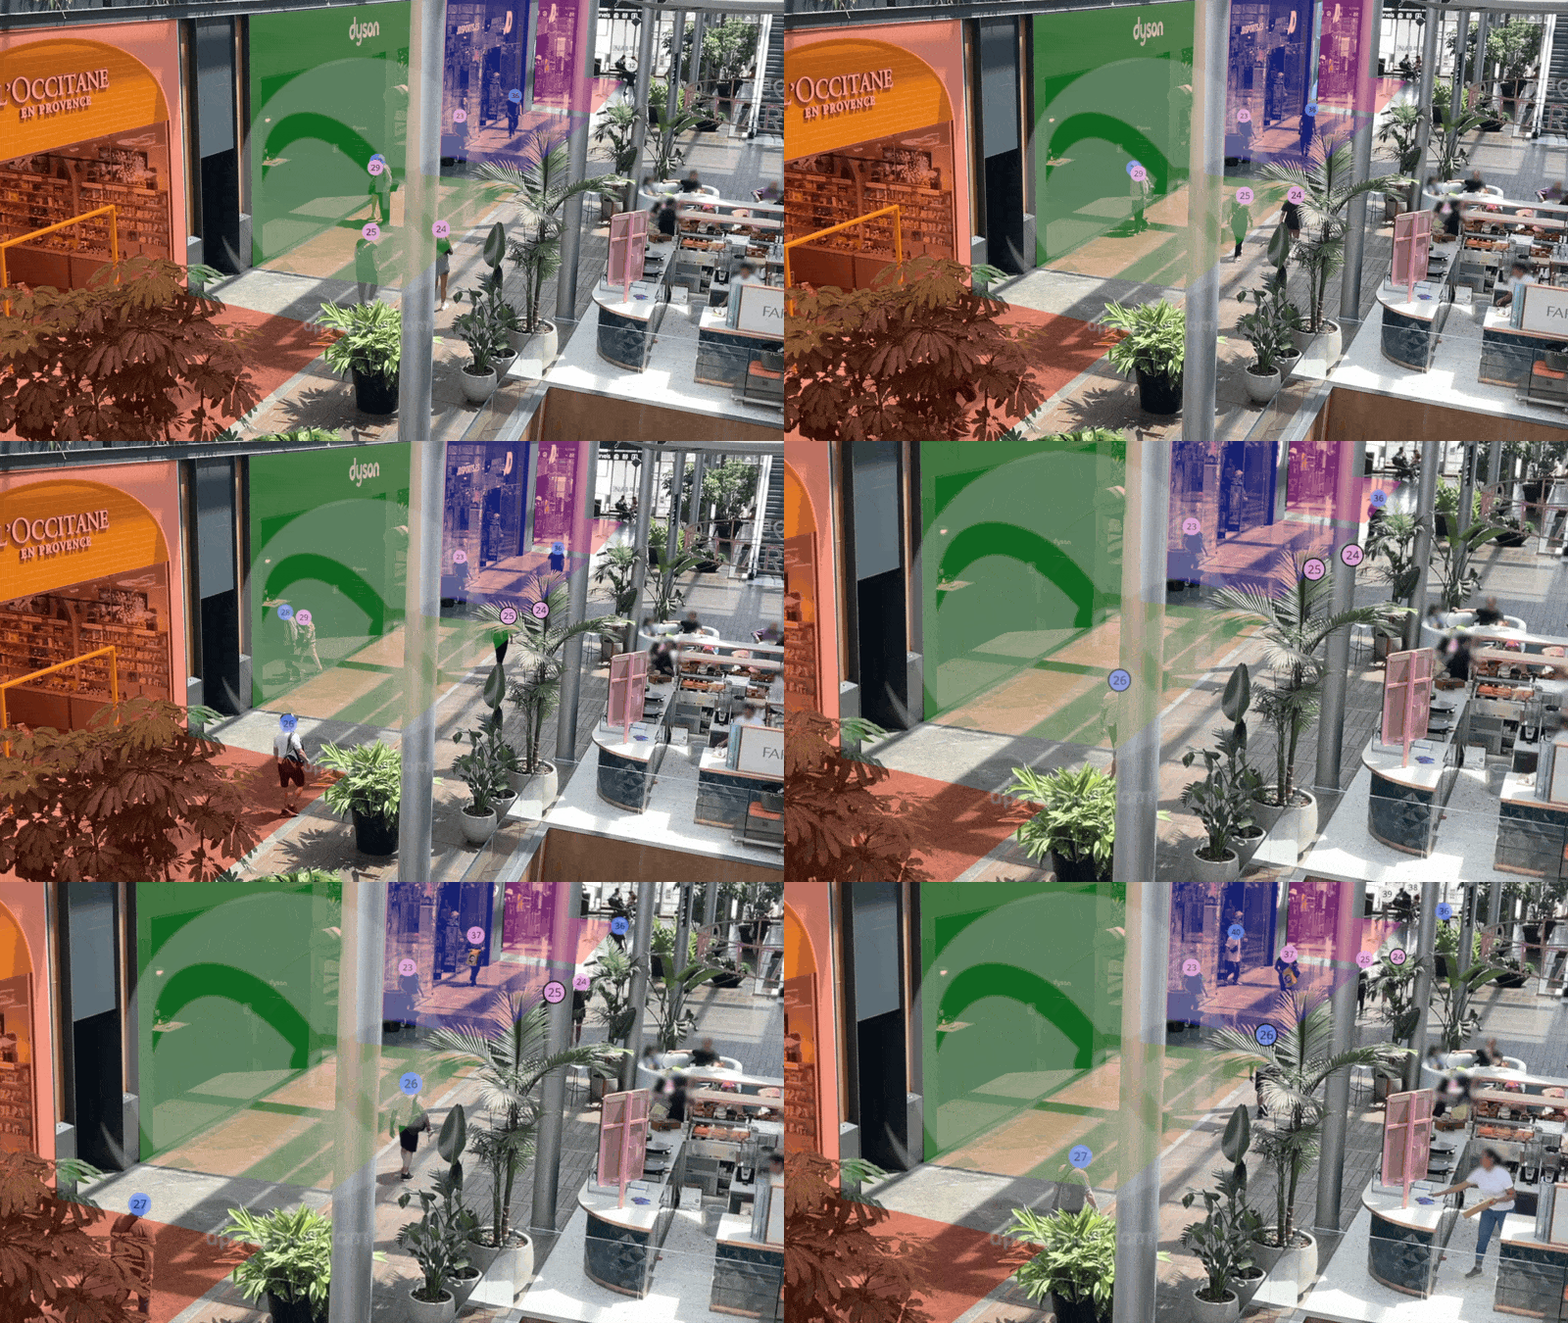
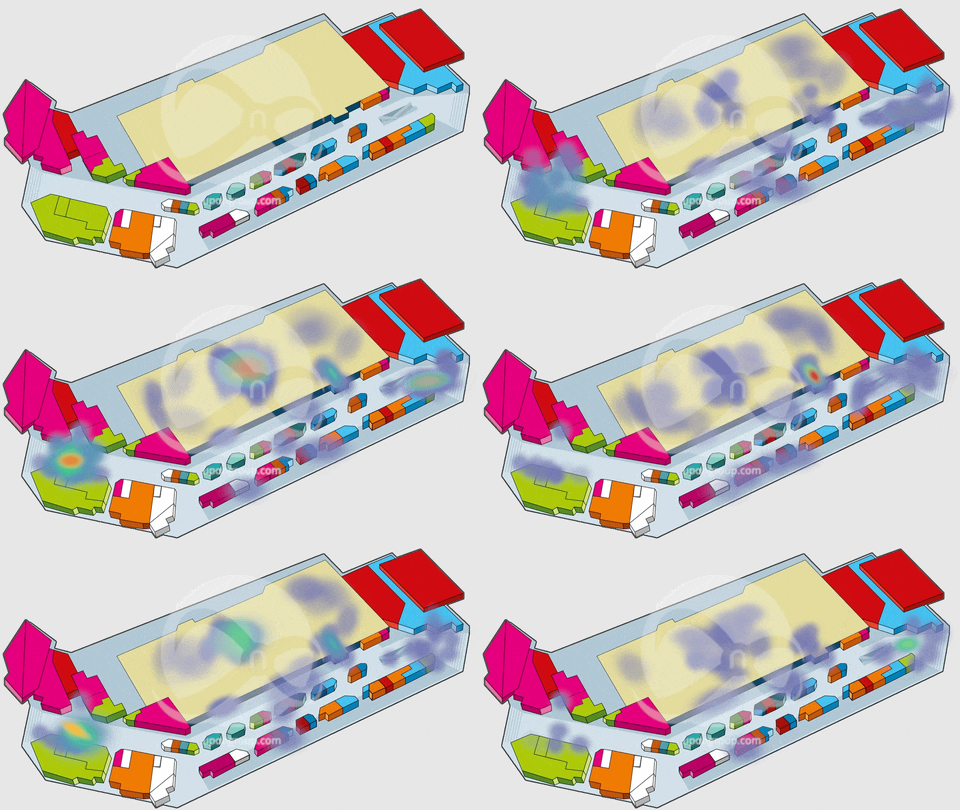
- Do you know exactly which zones of your shopping centre are 'dead', and why?
- Can you justify the rent to your tenants with real traffic figures for what passes their shop windows?
- Do your marketing campaigns and events really bring in shoppers? Or just people having a look?
- Do your cleaning and security suppliers really do their rounds and keep to their hours?
Stop running the place on hunches
Turn your building into an endless source of data. Use the security cameras you already have to understand how your visitors behave, with the same precision as an online shop.
▸Circulation zones and connectivity (flows)
How to optimise visitor flows in a shopping centre
Entrances and overall footfall
· Total entries (Footfall): accurate counting of people entering the centre, filtering out staff and bounces.
· Footfall peaks: identifying the exact 'peak hours' so security and cleaning can be sized to match.
· Door bounce rate: people who come into the lobby and turn round without reaching the retail areas.
Vertical movement (from storey to storey)
· Lift vs. stairs usage rate: % of visitors using each. Vital for preventive maintenance.
· Cross-floor flow: how many people go up from Storey 0 to Storey 1. It shows whether the upper storeys are 'cut off'.
· Lift waiting time: spotting queues at the lifts to avoid frustrating families and people with reduced mobility.
Navigation patterns
· Main Path: the 'ant trail' most people follow (e.g. 80% turn right on the way in). It helps price those units better.
· Congestion zones: spotting the aisles where the flow stops or bottles up, blocking circulation.
· Flow directionality: % of traffic going one way vs. the other in key aisles.
▸Retail zones (Retail &Tenant Mix)
How to increase conversion and shop profitability in a shopping centre
Attraction and shop windows
· Capture Rate: % of aisle traffic that goes into each shop.
· Attention rate (visual engagement): how long passers-by spend looking at a particular window, even if they don't go in.
· 'Halo' effect of anchor stores: how many visitors go to the main store and then visit the neighbouring shops.
Performance and conversion
· Shop ranking (Performance Index): tenants ranked by their ability to attract and hold traffic.
· Dwell Time in shop: average length of the visit in each unit. It correlates with average spend.
· Conversion rate (sales/visits): if it is integrated with the till system, % of visitors who end up buying.
Property strategy (Leasing)
· Profitability heat map: seeing which zones (m2) generate most traffic, so the rent can be adjusted.
· Cold vs. hot zones: spotting dead aisles that need an 'engine' or a change of use.
▸Service zones and customer experience (Customer Journey)
How to improve the visitor experience in a shopping centre
Hygiene and toilets (Facility Management)
· Uses per hour: exact number of entries to the toilets, so cleaning can be scheduled by real use and not by the clock.
· Cleaning SLA (compliance): % of times the cleaning staff turned up as agreed (e.g. every 100 uses).
Rest and comfort areas
· Occupancy of rest areas: % of benches or sofas taken. Are there too few seats at peak times?
· Environmental comfort index: (if there are sensors) temperature, humidity and CO2 in common areas.
· Density in the Kids Zone: occupancy control in children's areas for safety and comfort.
Information and digital services
· Waiting time at the info point: queues at the customer service desk.
· Use of digital directories: how many people interact with the digital maps.
· Service availability: status (working/faulty) of vending machines, lockers or trolleys.
▸Exclusive areas and events
How to get the most impact and profit out of events in shopping centres
Measuring events
· Event occupancy: exact number of people in the event area in real time.
· Attention time (Engagement): how many minutes people stay watching the show.
· Audience retention: do people stay to the end or leave after 5 minutes?
Audience profile (Marketing)
· Demographic segmentation: % of men/women and approximate age ranges at the event (anonymous).
· Group detection: are they families, couples or people on their own?
· Impact on the surrounding areas: did the event increase traffic in the nearby cafés?
VIP spaces and rooms
· VIP room/Lounge occupancy: occupancy control to keep it exclusive.
· VIP dwell time: average length of use of the premium facilities.
▸Operational and restricted areas (Back of House)
How to improve security and operational control in a shopping centre
Safety and control (Safety)
· Intrusion detection: an alert if somebody enters prohibited areas (service corridors, loading bays).
· Running/fall detection: an alert for unusual behaviour (people running, or someone down on the floor).
Logistics and suppliers
· Loading bay occupancy: space available for delivery lorries.
· Unloading time: keeping track of how long suppliers spend at the bays (to stop them overstaying).
· Waste control: visual monitoring of the compactor or bin areas (cleanliness/overflow).
Staff and maintenance
· Security round audit: checking that the guards pass the control points at the times set.
· Condition of the infrastructure: visually detecting open doors, blown lights or stopped escalators.
· Staff cover: making sure cleaning and security staff are present in the areas assigned.
▸Car park
How to optimise car park management in a shopping centre
Flow and access
· Waiting times at the barrier: exactly how long a car sits waiting to get in or out.
· Queue Length: number of vehicles built up at the entrances. If it goes over the threshold, an alert fires to open barriers or divert traffic.
· Vehicle flow per hour: rate of entry and exit, to predict when it will fill up.
· Time per vehicle: how fast the barrier processes each one (number plate read + opening).
Occupancy and profitability
· Overall and per-storey occupancy: % of spaces taken in real time. It lets dynamic signage guide cars to the empty storeys.
· Space turnover: how many times the same space is used in a day. High turnover is vital for shopping centres; low turnover can mean abandoned cars or employees taking customers' spaces.
· Free space count: the exact figure to show on the outdoor light panels.
· Reserved spaces (use vs. abuse): monitoring occupancy of disabled, family or electric charging spaces.
Behaviour and customer
· Dwell Time: average length of the visit.
· Segmentation by make and model: classifying the cars (high-end, SUVs, small hatchbacks). It helps define the visitor's socio-economic profile for selling advertising space.
· Repeat vehicles (loyalty): identifying (via anonymised number plate) cars that come every week vs. new visitors.
· Car park bounce rate: cars that come in, drive round looking for a space and leave without parking (a critical indicator of badly managed space).
Services and mobility (intermodal area)
· Queues at the t Lets taxi fleets be alerted when there is a lot of demand.
· Click & Collect congestion: monitoring the online order collection area. If it gets congested, the customer doesn't come back.
· Use of electric chargers: charging times and turnover in EV spaces.
Security and logistics (Back of House)
· Vehicles staying too long: a security alert if a car has been parked for more than 24h (possibly abandoned or stolen).
· Supplier car park occupancy: watching for congestion in the loading and unloading area so lorries don't block the customer entrances.
· Wrong-way detection: an immediate alert if a vehicle drives against the traffic on the ramps
Turn complex data into profitable decisions
Business Intelligence for shopping centres: your data, visual and clear
Having thousands of data points is no use if you can't read them in seconds
Having thousands of data points is no use if you can't read them in seconds.
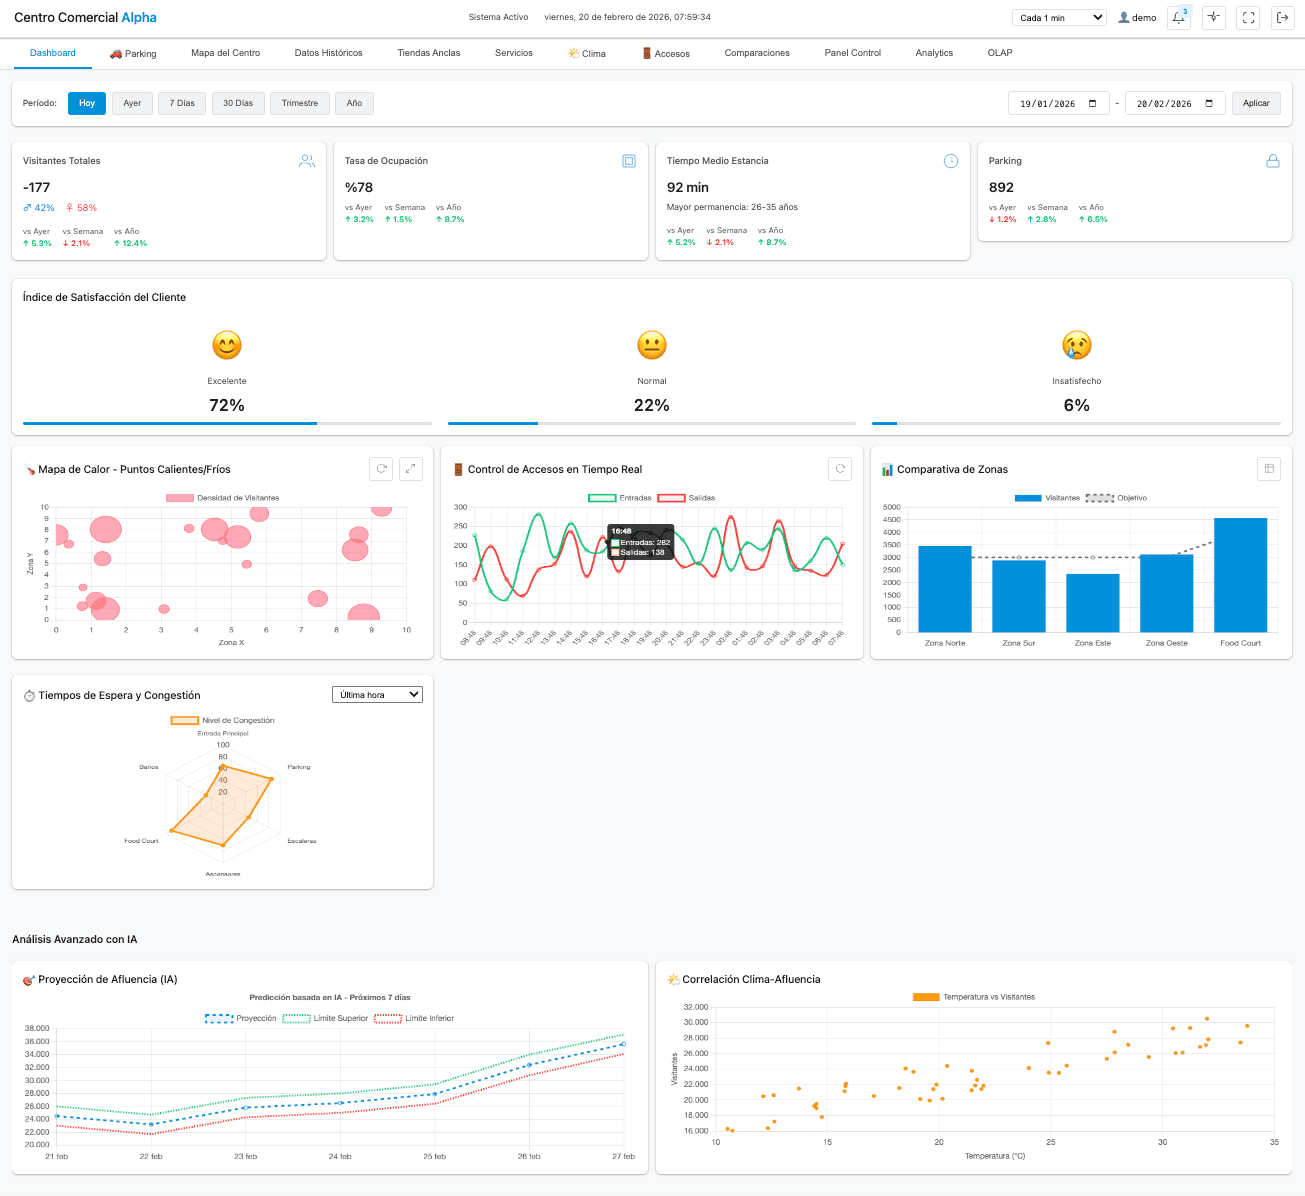
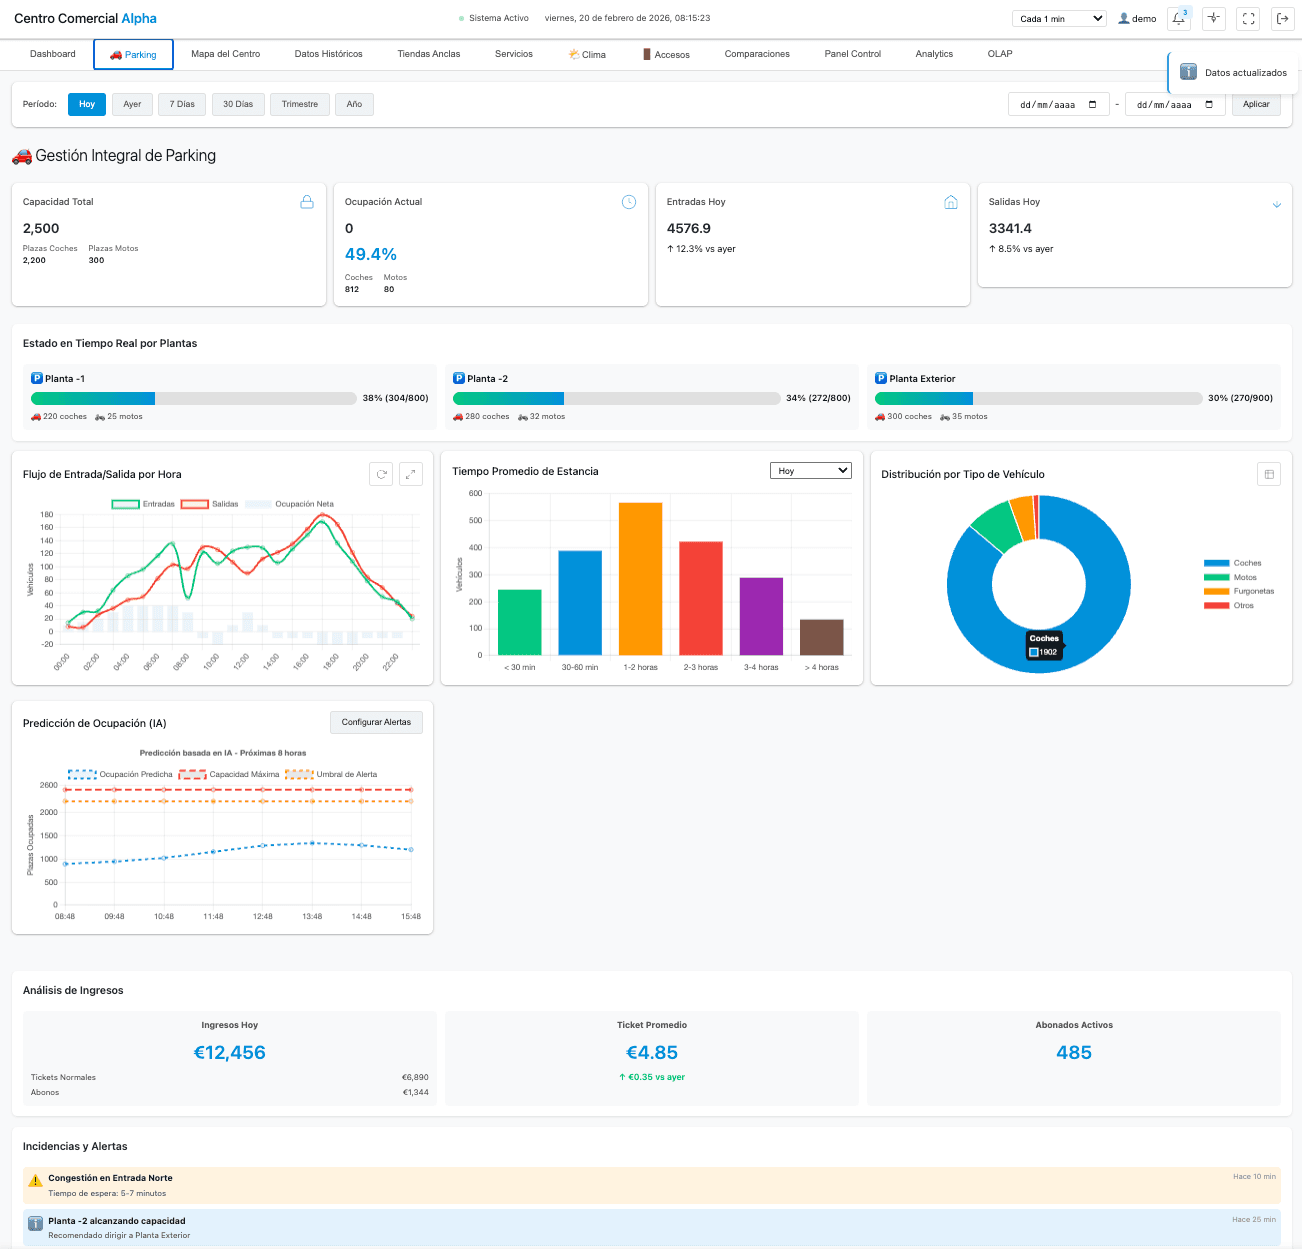
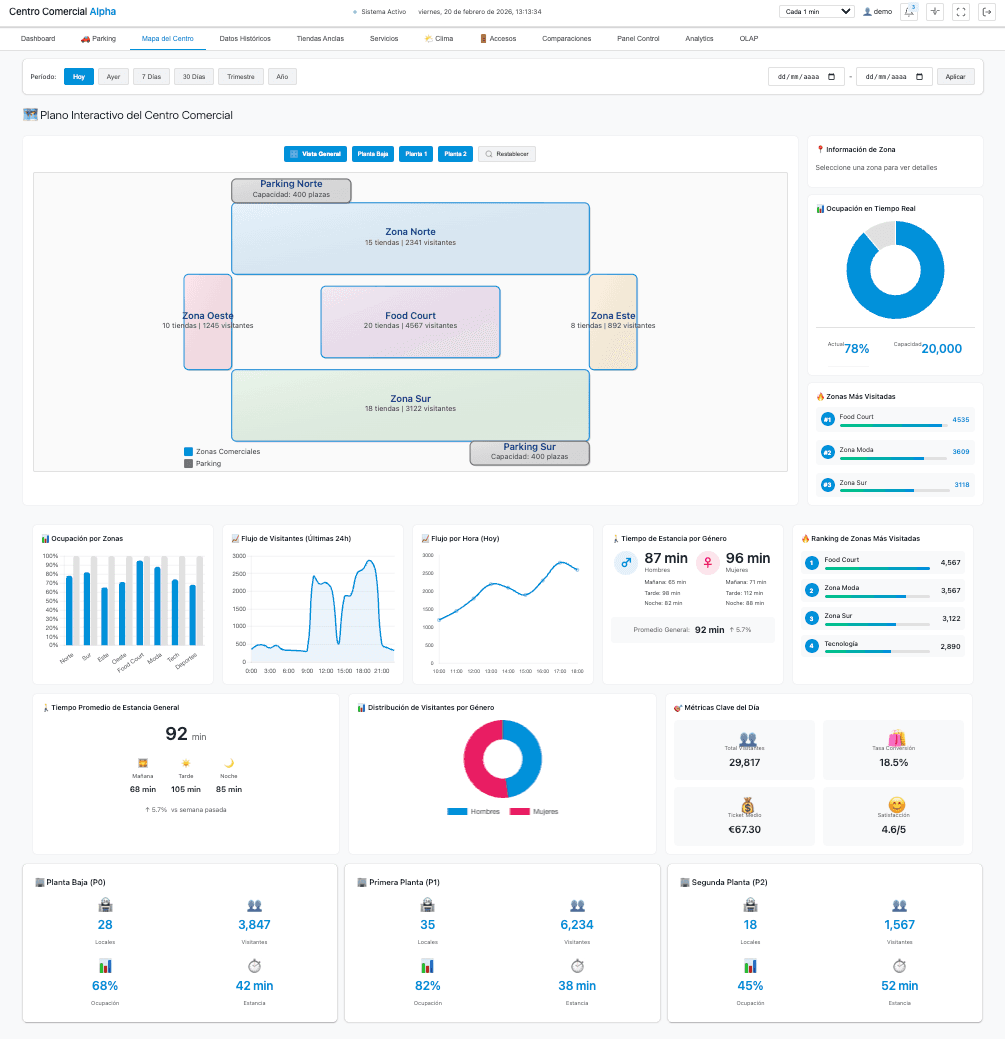
Neural BI is the definitive dashboard designed specifically for managing large retail sites. Unlike static paper reports, our platform turns the information gathered by your cameras into visual, dynamic, customisable insights. See your centre's overall performance at a glance (Performance Index), analyse heat maps, view the conversion funnel of your aisles and get ahead of what is coming: with predictive intelligence, the system analyses the history and outside variables to forecast footfall trends, so you can plan your resources in advance.
Benefits of putting Infinity Neural in
Estimated average ROI of between 3x and 6x in 12 months, depending on the sector.
Many companies have cameras installed, but:
- They are only used to review incidents after they happen
- They produce no measurable data
- They don't help cut operating costs
- They don't let you anticipate risks
- They give you nothing to work with to improve productivity
Infinity Neural turns cameras into automated analysis systems that can:
- Detect incidents in real time
- Measure times, flows and behaviour
- Generate automatic alerts
- Create operational indicators (KPIs)
- Prioritise maintenance by criticality
What your organisation gains:
- Fewer operating losses
- Fewer security incidents
- Better use of staff
- Shorter waiting times
- Predictive maintenance
- Measurable improvement in efficiency
What can you do with the information you get?
Interaction Solutions products connect to elements outside Infinity Neural so they can act on the information detected, or show the information gathered in our clients' digital solutions or in our Business Intelligence application. This adds to the effectiveness of our clients' current solutions, and drives interaction with machines and the automation of processes.
Connect our solutions to your own devices
Neural React
Neural React allows interconnection with third-party devices so that alarms sound, information or advertising screens show specific messages, and even text or voice messages are sent, all based on the information captured by our cameras.
This complete product offers a range of effective answers for communication, security and process management.
· Connect our system to advertising or information screens and tailor what is shown to the needs or interests of the target audience.
· Programme the real-time issuing of alerts or notifications and the interaction with machines or vehicles to ensure effective monitoring in a range of contexts.
· Plan the sending of voice and text messages so critical information travels quickly and efficiently, or so content can be tailored for advertising or other purposes.
· Connect our system to your alarm and control centre for a complete, detailed view of how the installations are running. Neural React logs incidents and processes alarms and notifications in real time, making a fast response to any emergency easier and keeping constant watch on the performance and status of systems and equipment.
Neural BI
Neural Business Intelligence stores and analyses information gathered from different sources and then presents it in reports, dashboards and data visualisations in a range of customisable formats, making patterns and trends easier to understand.
It is a tool that turns large amounts of data into useful, actionable information, making informed business decisions easier.
· Neural BI includes a set of key performance indicators (KPIs), both predefined and customisable, that let you measure how you are doing in different areas.
· The system has an easy-to-use interface, open to users according to customisable permission levels, and it provides sophisticated data analysis and valuable business insight.
· Neural BI stands out for its scalability and its ability to integrate with other business systems, working with every Neural solution and connecting without trouble to other applications and databases.
· Neural BI customer support makes sure companies can get the most out of what the platform can do.
Neural API
Neural API works as a bridge between systems, allowing information to be exchanged efficiently. This interface improves integration and cooperation between systems, allowing data to be exchanged and functions to be used without having to understand the other system in depth.
This tool is valuable for any company looking to improve the integration of its systems and get the most value out of its digital technologies.
· Beyond simple communication, Neural API also makes it easier to automate tasks, synchronise data in real time and reach third-party services, from customer management (CRM) and enterprise resource planning (ERP) systems to connections with social media platforms or data analysis systems.
· With Neural API, companies can build an integrated digital set-up covering all their systems and applications, improving operational efficiency and creating new business opportunities, a better customer experience and new sources of income.
· This application programming interface is extremely simple to implement and use. It also comes with full documentation and support, so you have nothing to worry about.
· Neural API works with every Neural solution.
Turn your difficulties into successes.
With Infinity Neural, you can turn every challenge into a chance to improve.
With Infinity Neural, you can turn every challenge into a chance to improve.
Get started
Your sector, your camera.
What is above is what is usually needed here. Yours may be something else: tell us about it.